In order to integrate Flash Charts Pro® in your web page use an HTML tag <object> in the main part of the HTML document (between <body> tags):
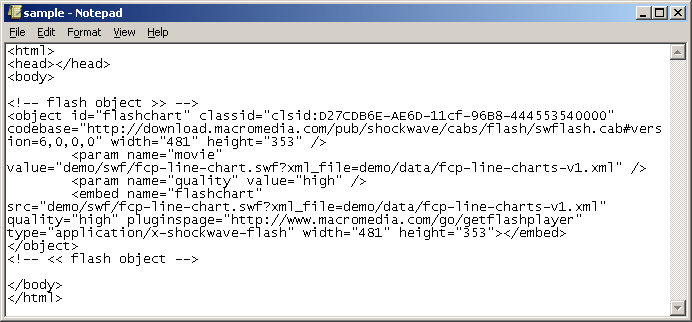
Flash-object should have a full path to the FCP Chart (relative, absolute or relative to root folder). In order to view Flash components in browsers different from Internet Explorer you should duplicate records in the attributes of the <embed> tag. Please refer to the specifications (or Adobe's guide) for detailed explanation.
Below are two different methods for how data can be loaded into flash charts. You can use whichever one suits your needs.
Data loading methods
There are two different methods for how data can be loaded into flash charts - through key variables xml_string and via an xml_file. Both variables are dynamic and thus on every data change a flash chart will be updated automatically. The difference between the two methods is:
xml_string - will load data by text string
xml_file - receives path to XML-file with data (use config instead, in the trial version of Flash Charts Pro)
Examples of adding the chart with different uploading methods
1) Load data sheet file as GET request (external XML file)
This method allows you to load data into a flash object (FCP) using a GET request. It's ideal for using in combination with AJAX technology. Used for client-side dynamic inserts by JavaScript, etc. The following is an example of code with instructions for such a method:
(X)HTML code:
<object id="flashchart" classid="clsid:D27CDB6E-AE6D-11cf-96B8-444553540000" codebase="http://download.macromedia.com/pub/shockwave/cabs/flash/swflash.cab#version=6,0,0,0" width="481" height="353">
<param name="movie" value="demo/swf/fcp-line-chart.swf?xml_file=demo/data/fcp-line-charts-v1.xml" />
<param name="quality" value="high" />
<embed name="flashchart" src="demo/swf/fcp-line-chart.swf?xml_file=demo/data/fcp-line-charts-v1.xml" quality="high" pluginspage="http://www.macromedia.com/go/getflashplayer" type="application/x-shockwave-flash" width="481" height="353"></embed>
</object>
Where:
Parameter |
Code |
Description |
Notes |
flashchart |
id="flashchart" |
Unique flash object name.
|
Actual for dynamic updates & more than two flash objects on a page. |
width, height |
width="481" height="353" |
Dimensions of the chart, e.g., clip area values in pixels (px). |
The chart is always drawn from the center and these two parameters control the clipping area. |
movie |
name="movie" value="demo/swf/fcp-line-chart.swf" src="demo/swf/fcp-line-chart.swf" |
Relative chart file |
You can use absolute, relative or root-based paths. |
xml_file |
?xml_file=demo/data/fcp-line-charts-v1.xml |
Load XML data (settings file), use xml_file variable |
You can use absolute, relative or root-based paths to your XML file with data. |
2) Load data sheet file through FlashVars (external XML file)
Using this method you can interact with a flash object (FCP) through FlashVar variables. The benefit of this method is that you can point data directly in special variables, (), controlling chart output through HTML code rather than through an external file.
(X)HTML code:
<object id="flashchart" classid="clsid:D27CDB6E-AE6D-11cf-96B8-444553540000" codebase="http://download.macromedia.com/pub/shockwave/cabs/flash/swflash.cab#version=6,0,0,0" width="481" height="353">
<param name="movie" value="demo/swf/fcp-line-chart.swf" />
<param name="quality" value="high" />
<param name="flashvars" value="xml_file=demo/data/fcp-line-charts-v1.xml" />
<embed name="flashchart" src="demo/swf/fcp-line-chart.swf" quality="high" pluginspage="http://www.macromedia.com/go/getflashplayer" flashvars="xml_file=demo/data/fcp-line-charts-v1.xml" type="application/x-shockwave-flash" width="481" height="353"></embed>
</object>
Where:
Parameter |
Code |
Description |
Notes |
flashchart |
id="flashchart" |
Unique flash object name.
|
Actual for dynamic updates & more than two flash objects on a page. |
width, height |
width="481" height="353" |
Dimensions of the chart, e.g., clip area values in pixels (px). |
The chart is always drawn from the center and these two parameters control the clipping area. |
movie |
name="movie" value="demo/swf/fcp-line-chart.swf" src="demo/swf/fcp-line-chart.swf" |
Relative chart file |
You can use absolute, relative or root-based paths. |
flashvars |
name="flashvars" value="xml_file=demo/data/fcp-line-charts-v1.xml" |
Load XML data (settings file), use xml_file attribute. |
You can use absolute, relative or root-based paths to your XML file with data. |
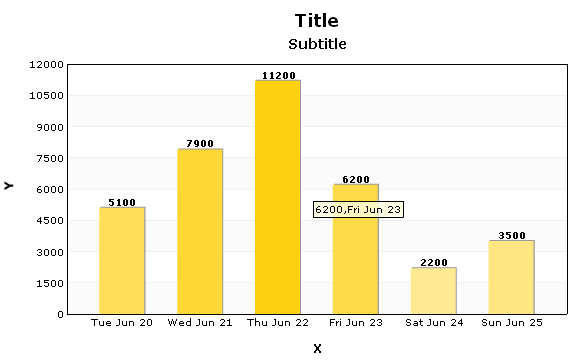
3) Load data sheet file through FlashVars (string data)
Using this method you can load data into a FCP Chart, putting them directly into HTML code. Be careful to use quotation marks and follow the right syntax (use escape functions before adding the code).
(X)HTML code:
<object id="flashchart" classid="clsid:D27CDB6E-AE6D-11cf-96B8-444553540000" codebase="http://download.macromedia.com/pub/shockwave/cabs/flash/swflash.cab#version=6,0,0,0" width="481" height="353">
<param name="movie" value="demo/swf/fcp-bars2d-charts.swf" />
<param name="quality" value="high" />
<param name="flashvars" value="xml_string=<graph><general_settings bg_color='ffffff' type_graph='v' /><header text='Title' font='Verdana' color='000000' size='18' /><subheader text='Subtitle' font='Verdana' color='000000' size='14' /><legend font='Verdana' color='000000' font_size='11' /><legend_popup font='Verdana' bgcolor='FFFFE3' font_size='10' /><Xheaders rotate='0' color='000000' size='10' title='X' title_color='000000' /><Yheaders color='000000' size='10' title='Y' title_rotate='90' title_color='000000' /><grid grid_width='500' grid_height='250' grid_color='D2D2D2' grid_alpha='30' grid_thickness='1' bg_color='ffffff' bg_alpha='70' alternate_bg_color='F9F9F9' border_color='000000' border_thickness='1' /><bars view_value='1' width='45' space='0.5' alpha='100' view_double_bar='1' color_double_bar='999999' pieces_grow_bar='50' /><data name='Tue Jun 20' value='5100' color='FFDE5B' /><data name='Wed Jun 21' value='7900' color='FFD737' /><data name='Thu Jun 22' value='11200' color='FFD012' /><data name='Fri Jun 23' value='6200' color='FFDB49' /><data name='Sat Jun 24' value='2200' color='FFE992' /><data name='Sun Jun 25' value='3500' color='FFE680' /></graph>" />
<embed name="flashchart" src="demo/swf/fcp-bars2d-charts.swf" quality="high" pluginspage="http://www.macromedia.com/go/getflashplayer" flashvars="xml_string=<graph><general_settings bg_color='ffffff' type_graph='v' /><header text='Title' font='Verdana' color='000000' size='18' /><subheader text='Subtitle' font='Verdana' color='000000' size='14' /><legend font='Verdana' color='000000' font_size='11' /><legend_popup font='Verdana' bgcolor='FFFFE3' font_size='10' /><Xheaders rotate='0' color='000000' size='10' title='X' title_color='000000' /><Yheaders color='000000' size='10' title='Y' title_rotate='90' title_color='000000' /><grid grid_width='500' grid_height='250' grid_color='D2D2D2' grid_alpha='30' grid_thickness='1' bg_color='ffffff' bg_alpha='70' alternate_bg_color='F9F9F9' border_color='000000' border_thickness='1' /><bars view_value='1' width='45' space='0.5' alpha='100' view_double_bar='1' color_double_bar='999999' pieces_grow_bar='50' /><data name='Tue Jun 20' value='5100' color='FFDE5B' /><data name='Wed Jun 21' value='7900' color='FFD737' /><data name='Thu Jun 22' value='11200' color='FFD012' /><data name='Fri Jun 23' value='6200' color='FFDB49' /><data name='Sat Jun 24' value='2200' color='FFE992' /><data name='Sun Jun 25' value='3500' color='FFE680' /></graph>" type="application/x-shockwave-flash" width="481" height="353"></embed>
</object>
Where:
Parameter |
Code |
Description |
Notes |
flashchart |
id="flashchart" |
Unique flash object name.
|
Actual for dynamic updates & more than two flash objects on a page. |
width, height |
width="481" height="353" |
Dimensions of the chart, e.g., clip area values in pixels (px) |
The chart is always drawn from the center and these two parameters control the clipping area. |
movie |
name="movie" value="demo/swf/fcp-bars2d-charts.swf" src="demo/swf/fcp-bars2d-charts.swf" |
Relative chart file. |
You can use absolute, relative or root-based paths. |
flashvars |
name="flashvars" value="xml_string=<code>" |
Load XML data (string), use xml_string variable. |
Escape double/single quotes before placing inline code. |
Resulting chart: